¶ Historical Draft Value
There are many ways to evaluate how successful teams are at drafting. One simple way would be to look at total WAR accumulated by drafted players over time. However, this effectively penalizes teams who always draft late, since the expected career WAR of players in a draft falls off very quickly even through the first round.
The Draft Value feature on StatsPlus totals the career WAR of players taken at each draft position, a fits a curve to compute an "expected WAR" at each slot over a requested set of seasons.
This can be useful both when considering draft pick trades, and evaluating how well a team has drafted in the past.
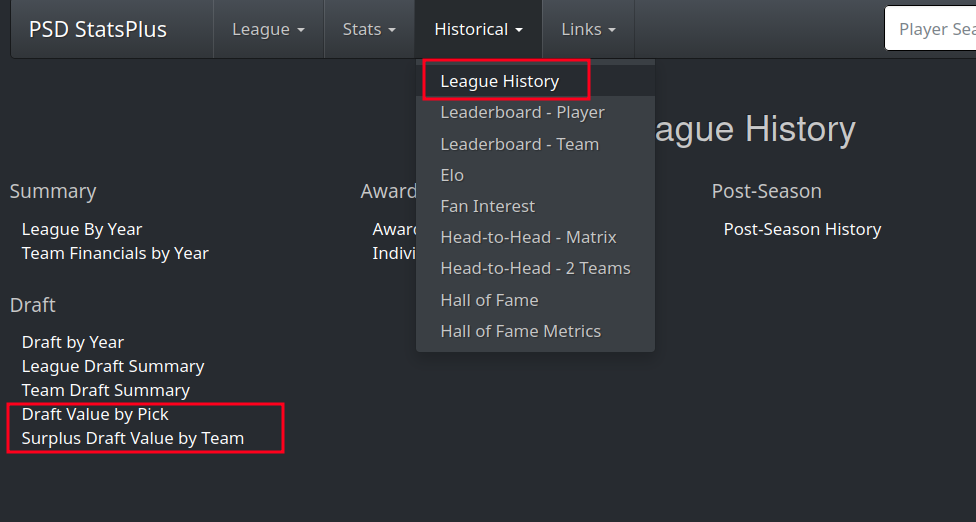
There are two pages related to draft value on the League History page on StatsPlus, "Draft Value by Pick" and "Surplus Draft Value by Team".
¶ Draft Value by Pick
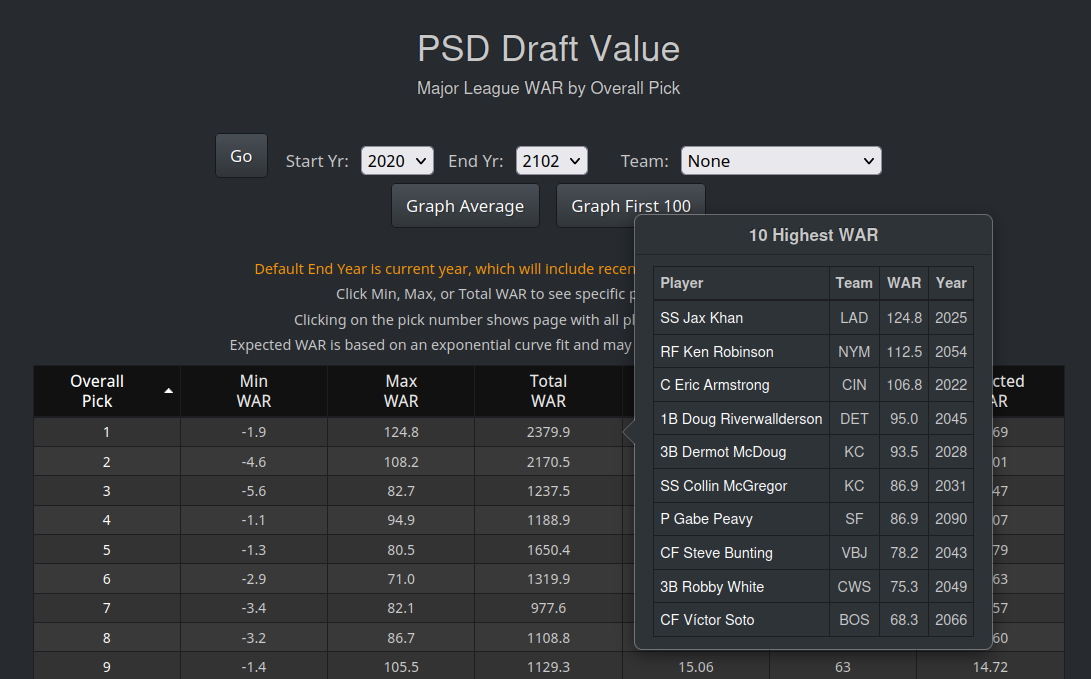
The primary "Draft Value" page takes a start and end year and shows the total WAR for each pick number, along with an "expected" WAR based on fitting a curve to the actual totals.
The default table shows the minimumm, maximum, total, and average WAR at each pick number, along with the number of players drafted there who have reached the majors. Clicking on the value in the minimum, maximum, and total column will bring up related players in a popup:
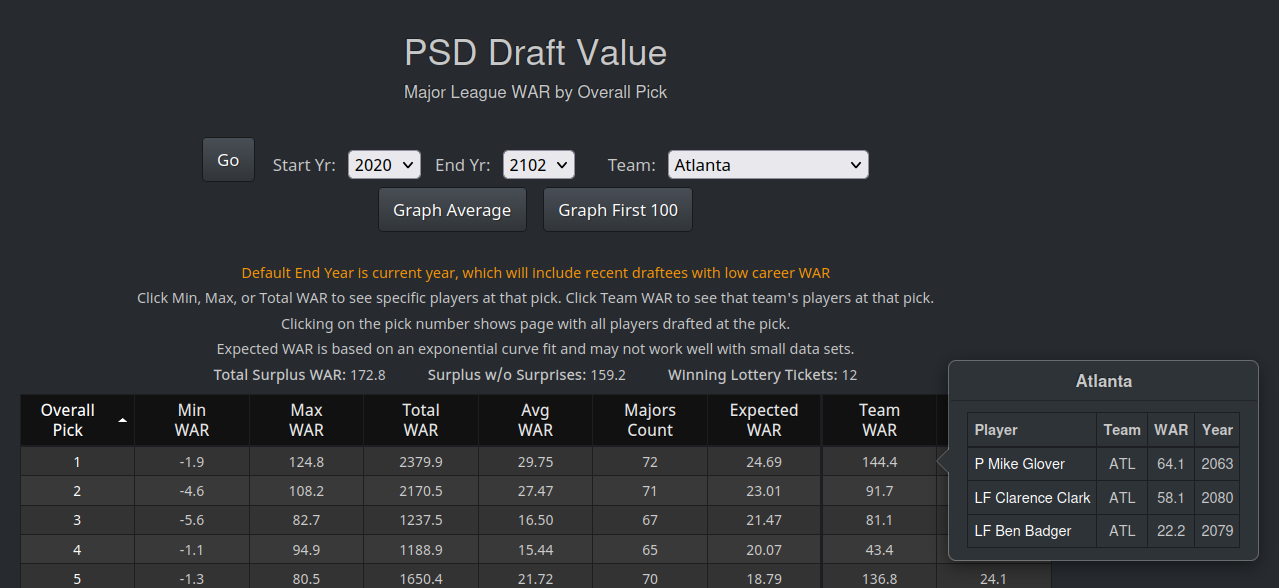
Optionally, a single team can be selected, which will show additional information about the picks the team has made at each draft position, along with the "surplus" a team has at that pick number.
For example, if the Expected WAR for a pick number is 10, and the user has made 3 picks in that slot, over time they would be expected to have 30 total WAR between those 3 players. The Surplus column will then show the delta of the 3 players from 30 WAR. In the following screenshot, Atlanta has picked in the 1st position 3 times, and those 3 players have accumulated 144.4 WAR, while the expected career WAR for the 1-1 pick in this league is only 24.7, so this team has done well picking at 1-1. Note clicking on the value in the Team WAR column brings up the popup showing the players picked by the team at that position.
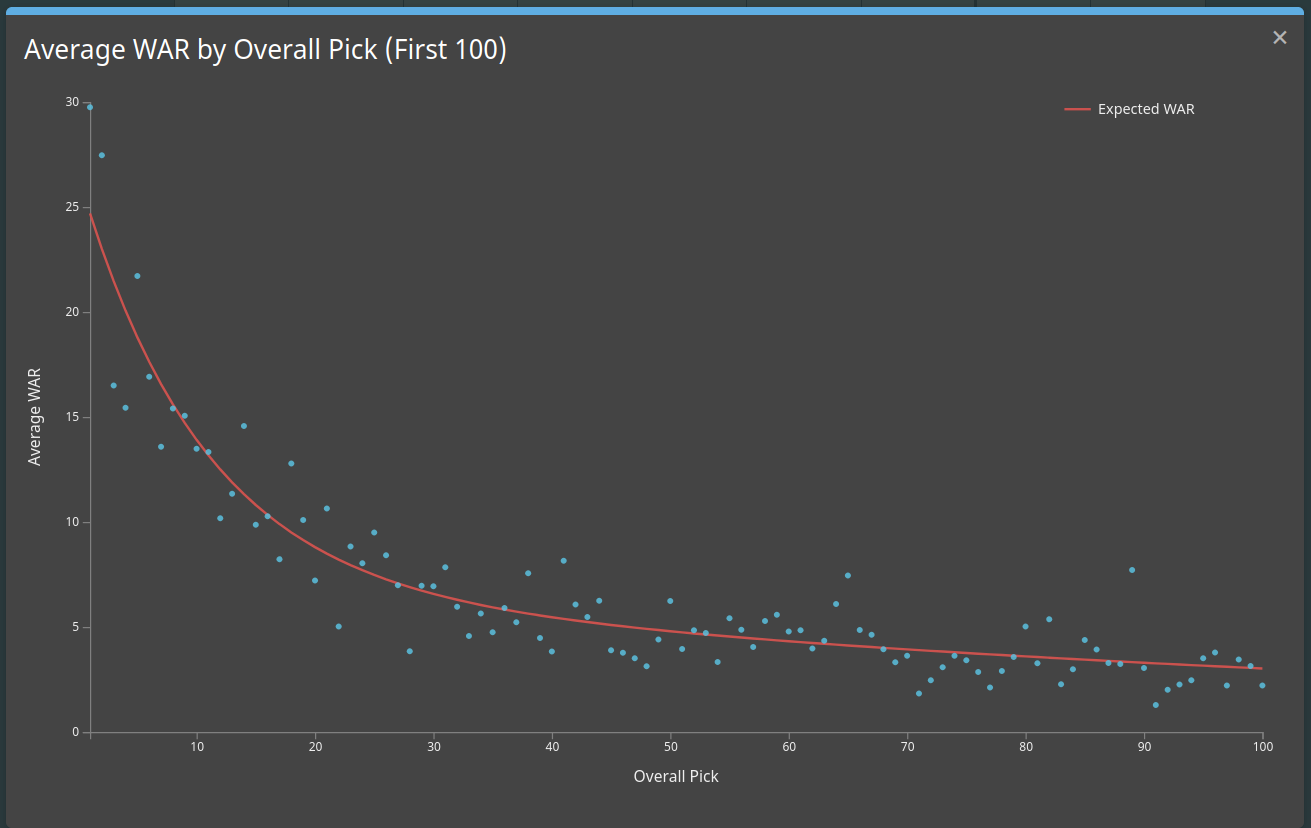
Clicking on the "Graph" buttons at the top will show a plot of the WAR at each pick position, and then the fit curve going through the points:
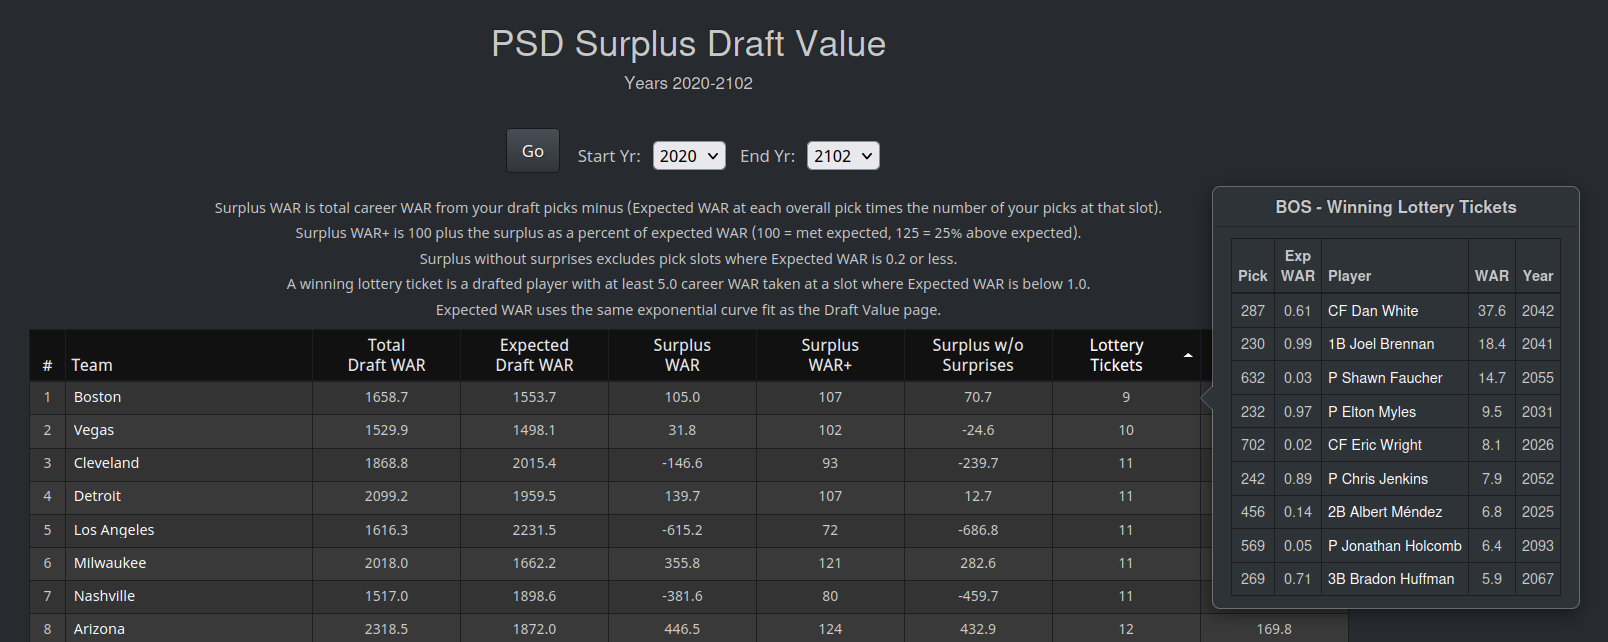
¶ Surplus Draft Value by Team
The Surplus by Team page summarizes each team's "surplus" vs. expected WAR at each pick position. The same curve is calculated for the data on this page as described in the previous section, and then used to evaluate each team.
The Surplus WAR is the basic evaluation metric here, it shows how well a team does vs. the expected pick positions they've had over a longer time period. To further evaluate Surplus WAR, a Surplus WAR+ is calculated, basically normalizing Actual Draft WAR vs. Expected Draft WAR to a baseball-style "plus" statistic, essentialy the % above or below expected. (25% above expected would show as 125).
This page also introduces two terms:
- Surprises - Any pick position where the expected career WAR is less than 0.2
- "Winning Lottery Ticket" - A player who accumulated 5+ career WAR from a pick slot where the expected draft WAR is less than 1.0.
This leads to a column "Surplus w/o Surprises", which excludes from the Surplus calculation all late round picks who blossomed into a useful player. In general, these picks are likely not skill picks, it was just a fortunate player development which led to the surplus.
The columns called "Lottery Tickets" and "Lottery Ticket WAR" show the number of players who are considered Winning Lottery Tickets by the above definition, and the total WAR accumulated by those players. Clicking on the value in the "Lottery Tickets" column brings up the list of qualifying players.
¶ Important Note
Currently, the expected WAR curve is fit by excluding the maximum and minimum WAR of players in pick positions in the "tail" of the curve. Over time, most teams get a few late round surprises, which results in most teams ending up with a Surplus WAR+ over 100. Essentially, this is by design, so the best use of this data is relative to other teams, not absolute.